BatchQC ComBat
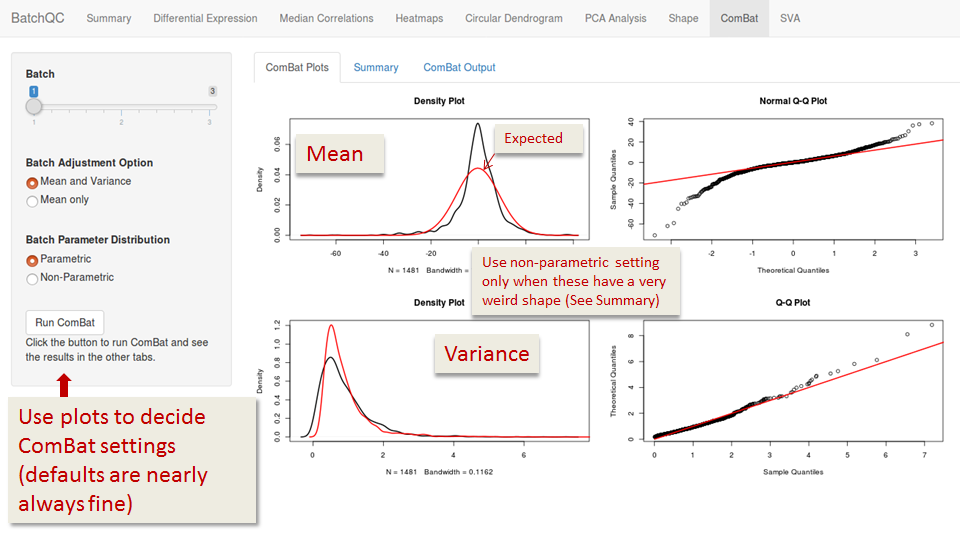
ComBat Plots
These plots are generated by ComBat itself. They include density plots for mean and variance, and QQ Plots:
library(fortunes)
fortune('chicken')

A sufficiently trained statistician can read the vagaries of a Q-Q plot like a shaman can read a chicken's
entrails, with a similar recourse to scientific principles. Interpreting Q-Q plots is more a visceral than
an intellectual exercise. The uninitiated are often mystified by the process. Experience is the key here.
   -- Department of Mathematics and Statistics, Murdoch University
      StatsNotes
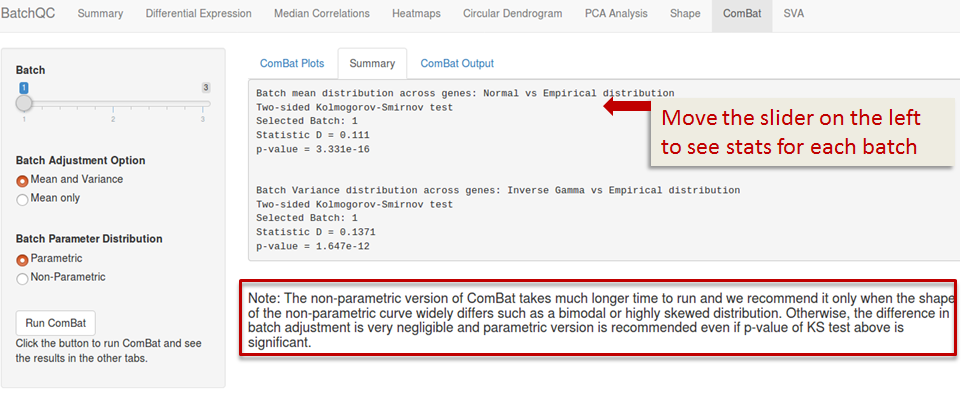
Summary
ComBat Output
This tab is empty until you run ComBat using the button in the left panel. Afterwards, it refers you to the other tabs, where you will now be able to select post-ComBat plots by selecting the radio button.