BatchQC PCA Analysis
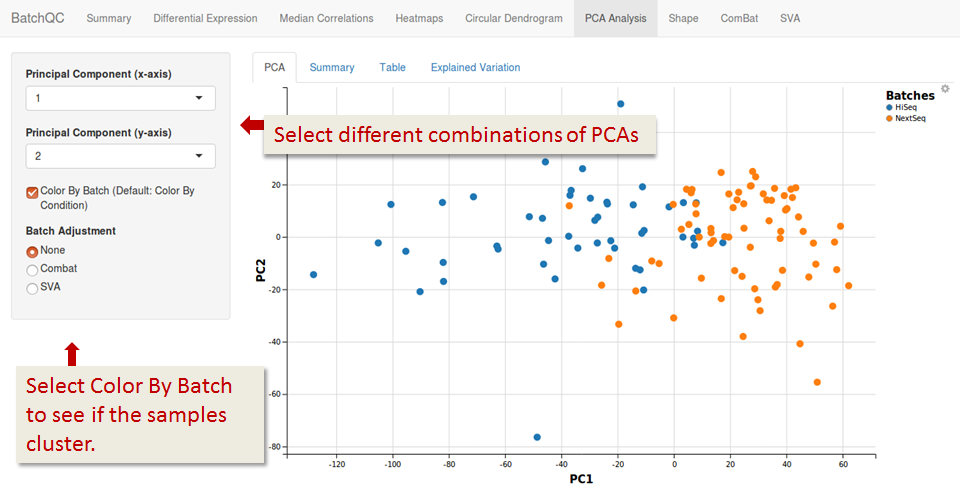
PCA

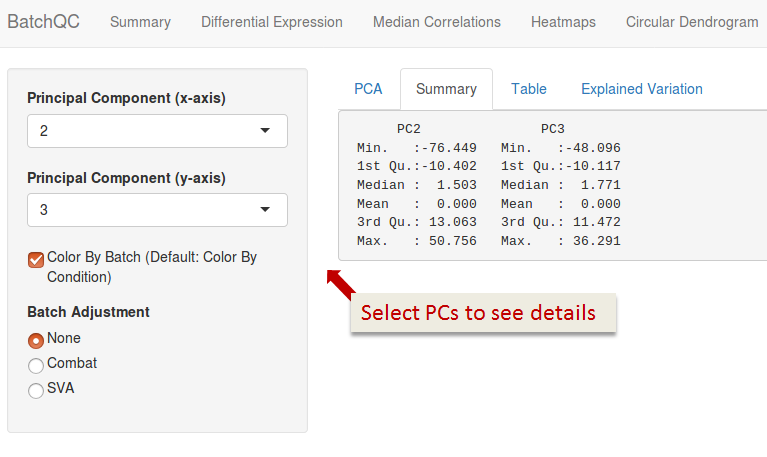
Summary

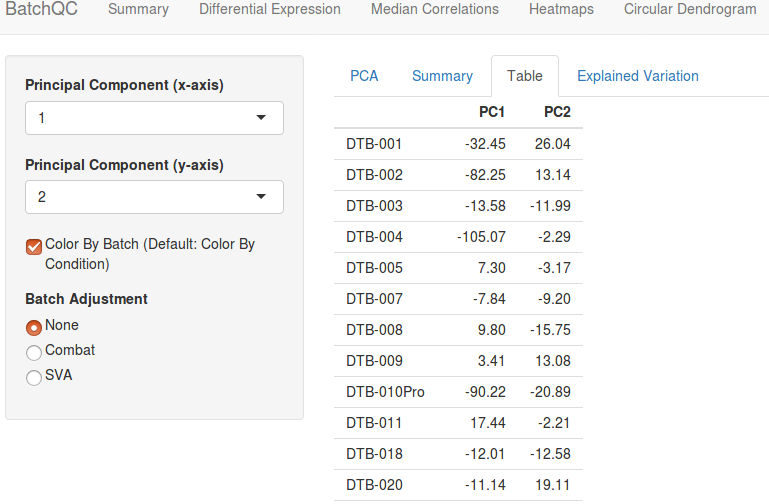
Table
The X/Y coordinates of each sample in the plot.

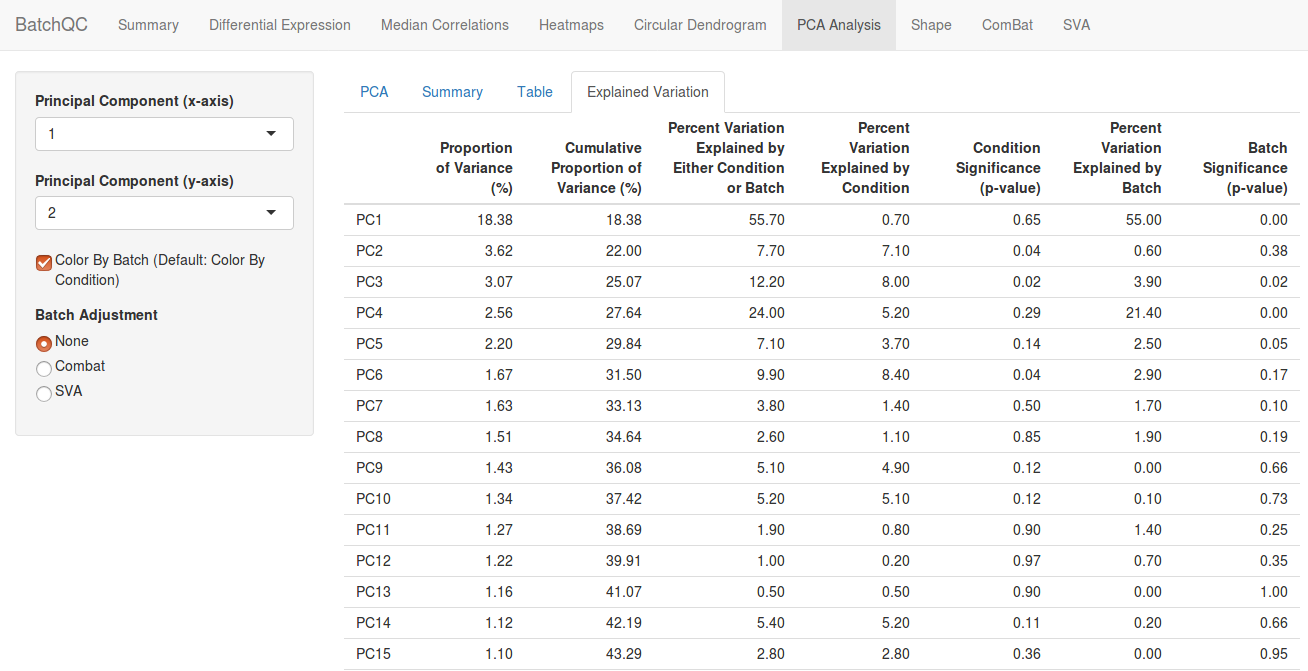
Explained Variation
Details on each principal component including how much of the Condition and Batch is explained by it.


The X/Y coordinates of each sample in the plot.

Details on each principal component including how much of the Condition and Batch is explained by it.
