BatchQC Summary
The Summary shows you how much influence your batch has on the signal of your condition of interest.
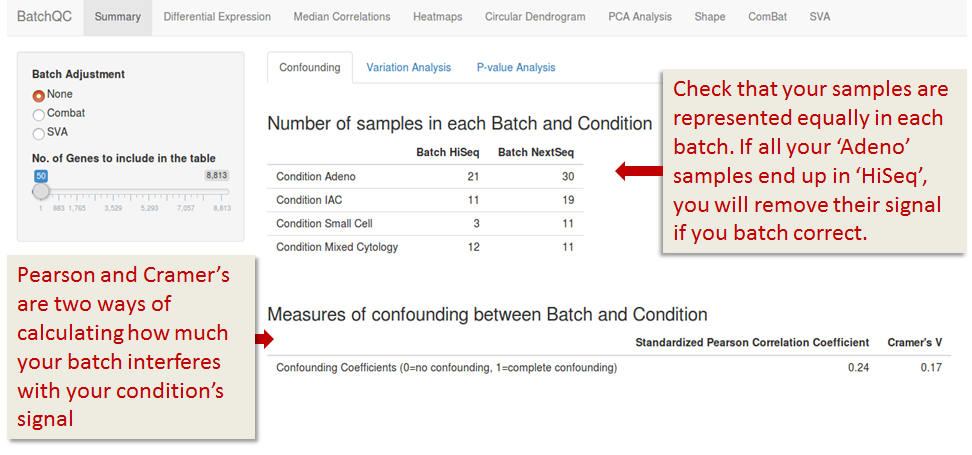
Confounding
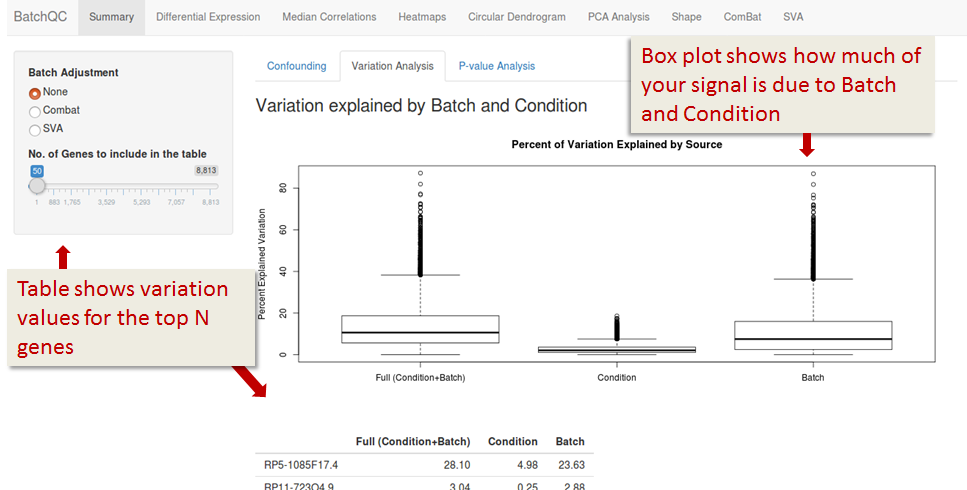
Variation Analysis
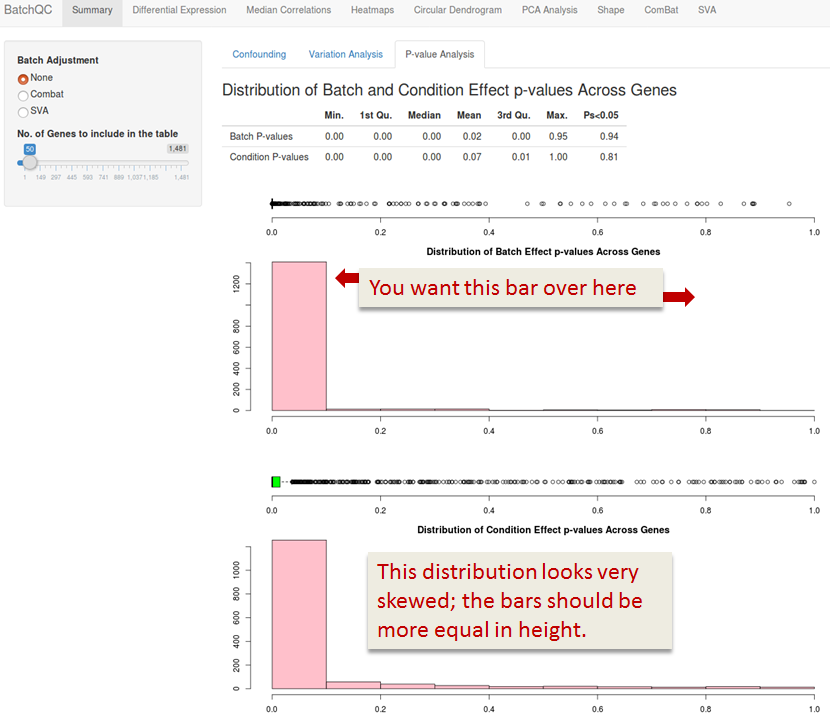
P-value Analysis
P-values are calculated per gene, it shows you the probability that your gene is influenced by your batch or your condition. In a corrected dataset, batch related P-values should be 1 and condition related P-values should have an even distribution - you don't expect most of your genes to have an effect on your condtion (also see QQ plots under the ComBat tab).