BatchQC Heatmaps
Gene by Sample
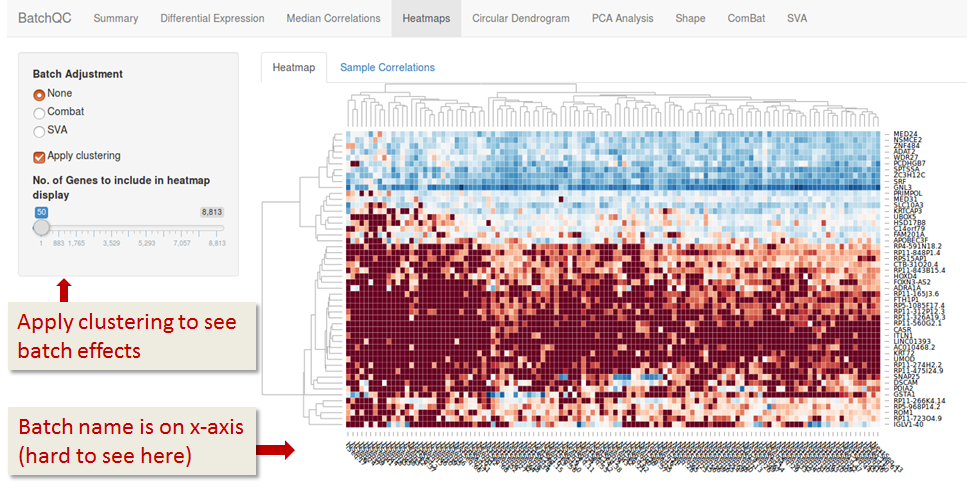
This heatmap shows individual gene expressions for all the samples; the samples have been renamed to include their Batch identifier (here HiSeq and NextSeq). Unfortunately the map shows all samples, which makes it hard to read their identifiers. The number of genes displayed can be selected.

Sample by Sample
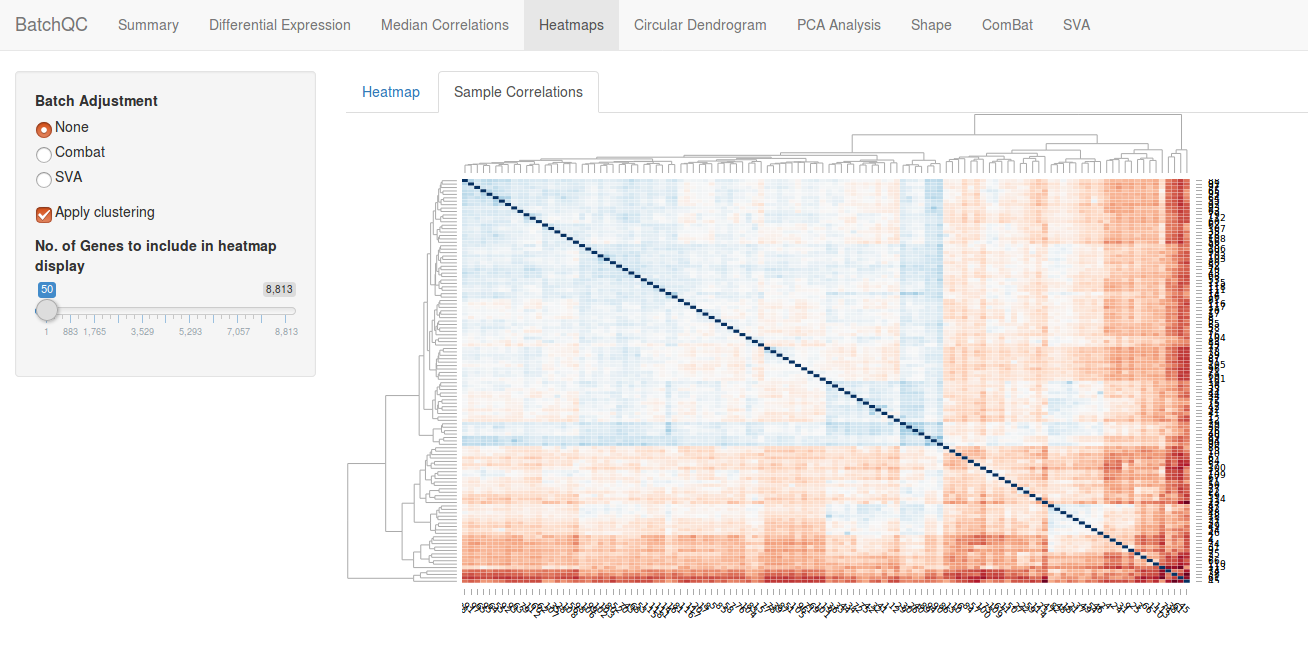
This doesn't show you a batch effect directly (for that, see Circular Dendrogram) but you do expect a shift in the pattern after batch correction. Compare this map to the one you get from running ComBat or SVA.

