BatchQC Differential Expression
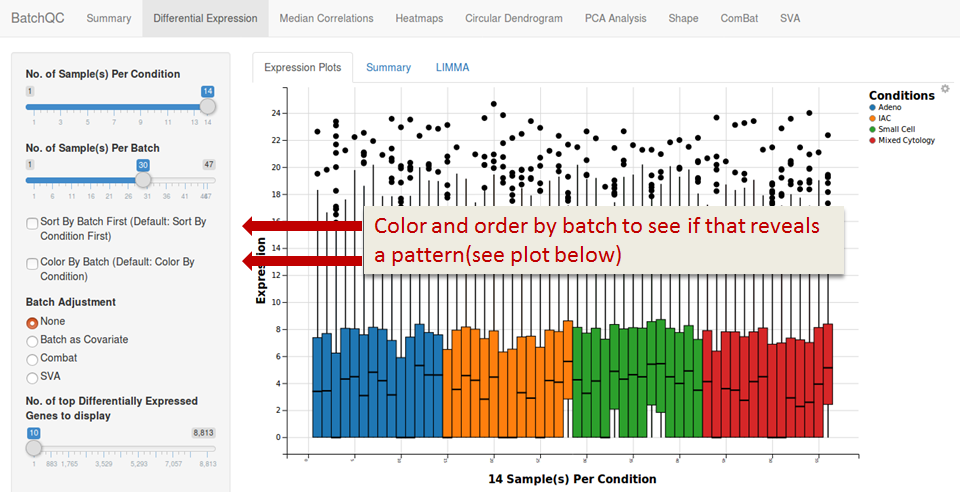
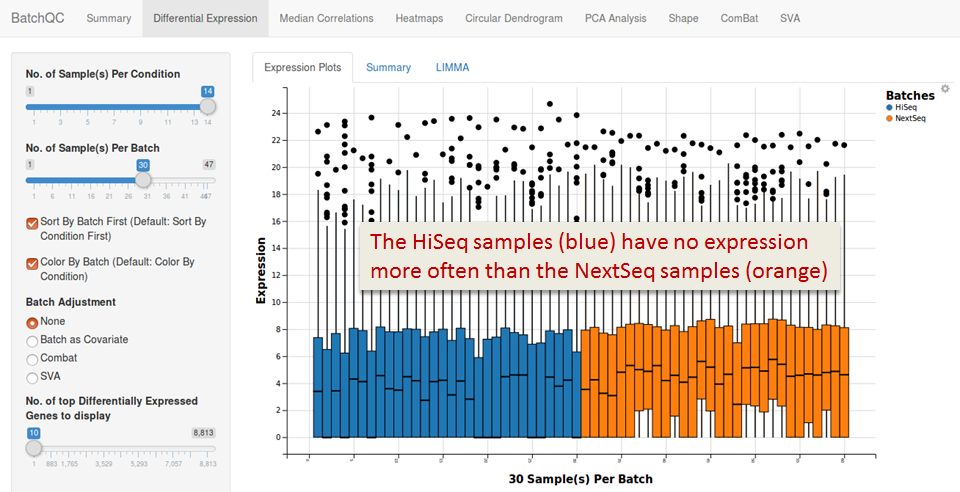
Expression Plots
These box plots show the median, SD, and outliers of expression values in your samples. Note that not all samples are shown: the program selects the Condition (or Batch) with the lowest number of samples (here: 14).
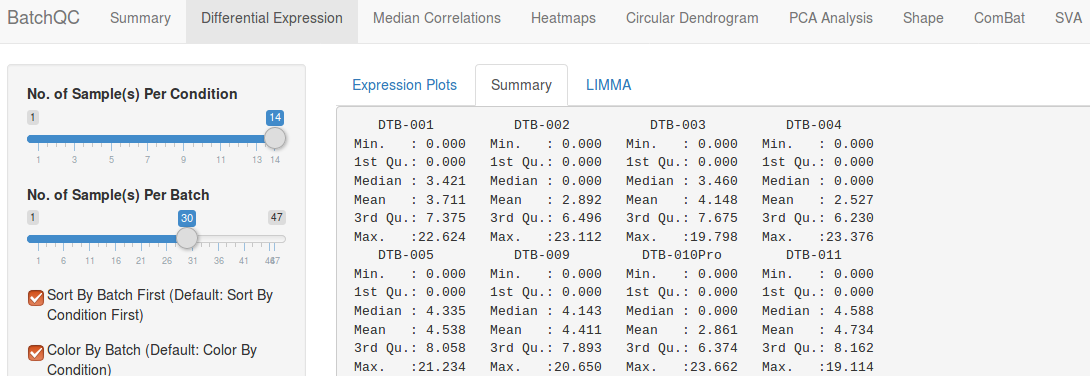
Summary
This is the data underlying the plot.
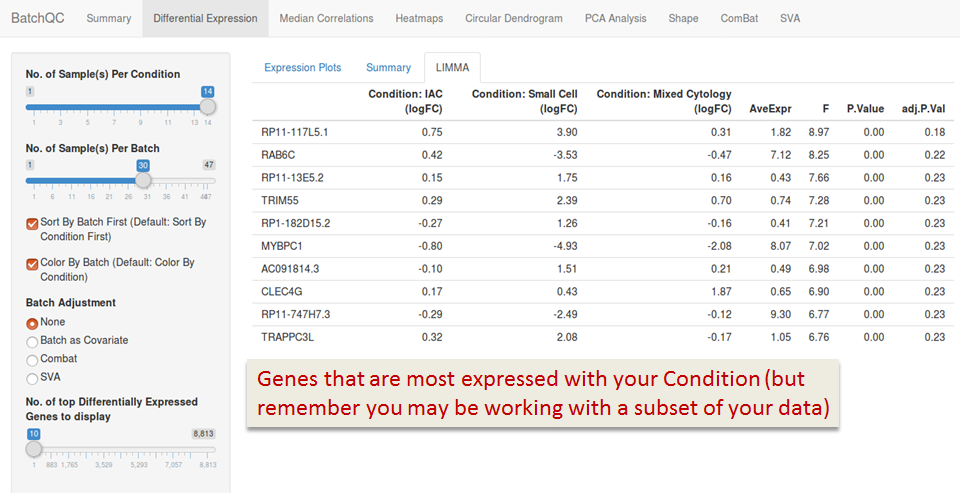
LIMMA