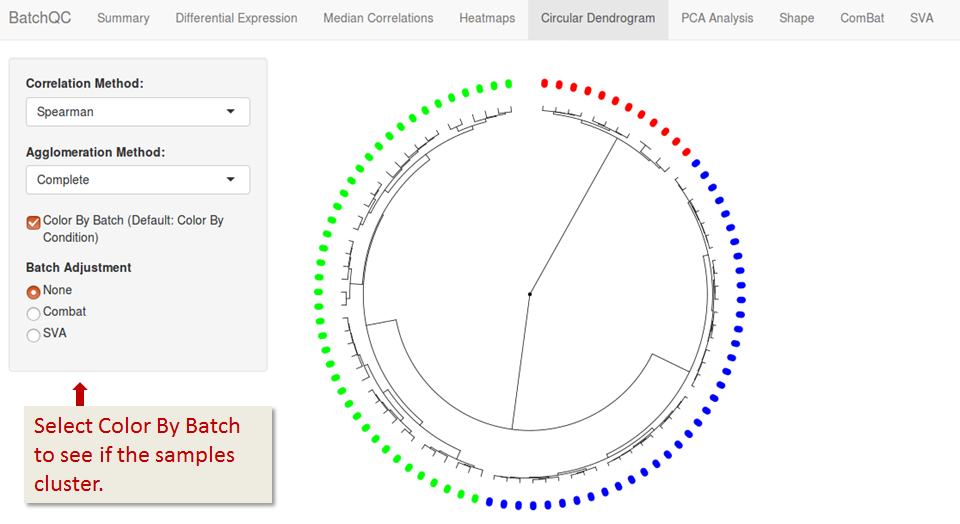
BatchQC Circular Dendrogram
This graph shows you how the samples cluster, based on their gene expressions. The default setting is colored by Condition and you expect to see groupings of color. If there is a batch effect you will see grouping by Batch instead.