WormPhenotypeSimilarity
Figures
Figure 1. Comparison of metric precisions- Using GO as the gold standard Fig_PrecRecGo-4.doc
- Using Kegg as the gold standard Fig_PrecRecKegg-4.doc
- Using Co-expression as the gold standard Fig_PrecRecExpression-4.doc
- Using PPIs as the gold standard Fig_PrecRecP2P-4.doc
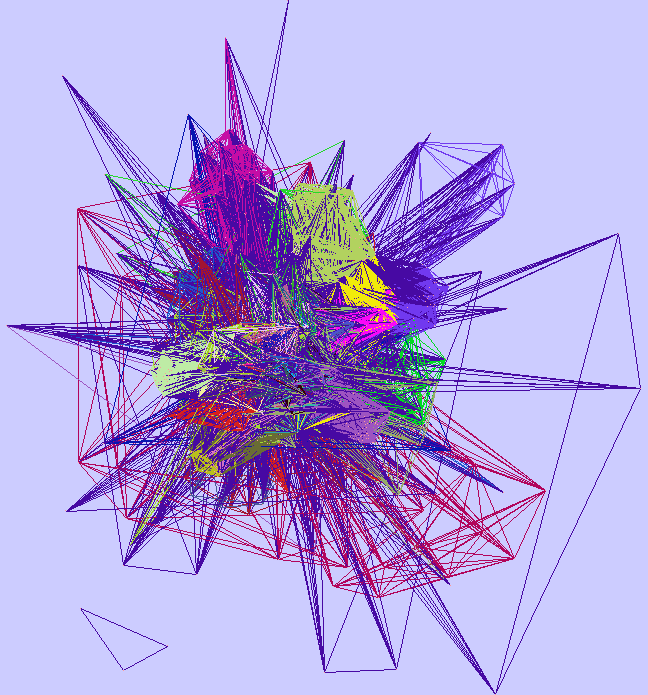
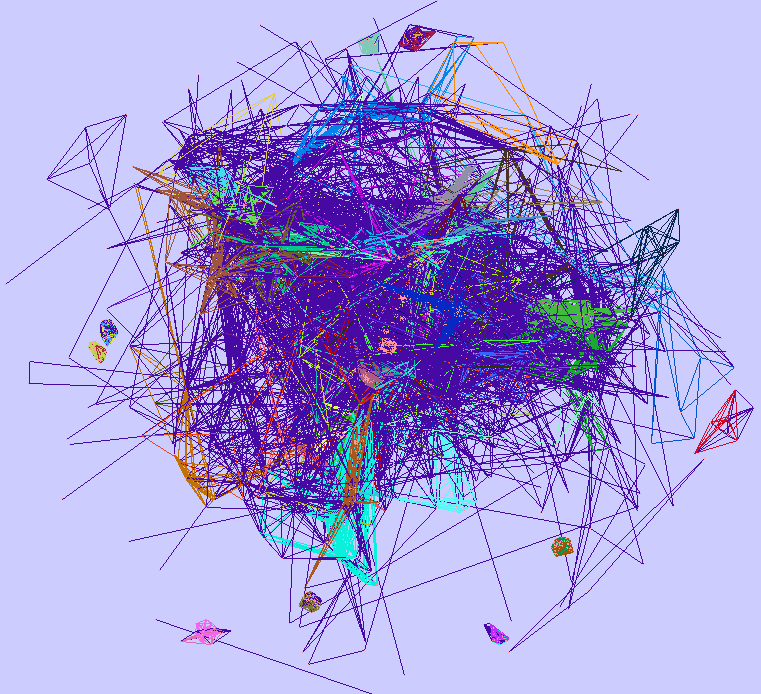
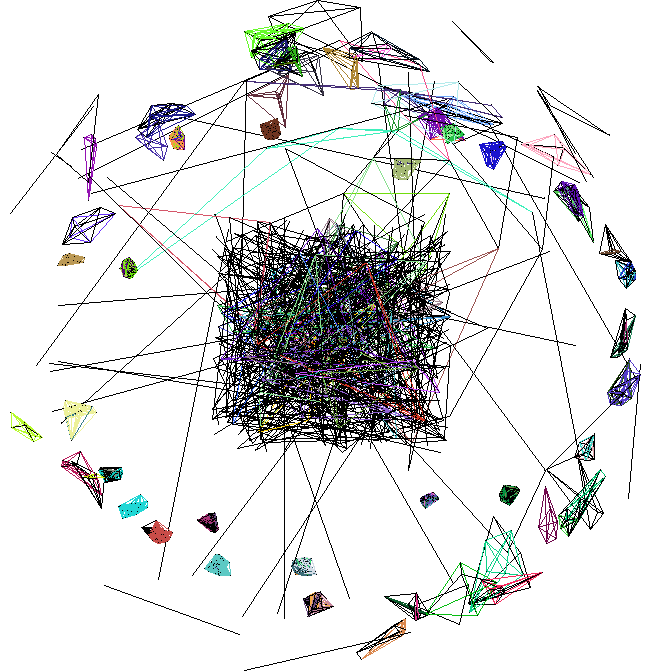
- SuperImposed? IDF/uncCorr network Fig_Networks-3.doc
- Comparison of number of shared phenotypes per linked gene pair Fig_NumPhenosPerLink-2.doc
- Same figure, restricted to gene pairs that share EMB, the highest frequency phenotype (53% of genes have it.) This underscores the problem of Unc Corr linking genes that share few common phenotypes Fig_NumPhenosPerLink_EMB-2.doc
- High level view of modules identified using each metric Fig_modules_with_phenos.doc
- Comparison of number of enriched phenotypes per module Fig_ModulePhenoEnrichment.doc
- Modules identified in Coexpression and PPI Networks
- Modules identified in Coexpression, PPI, and IDF Networks
- Modules identified in Coexpression, PPI, and uncCorr Networks
Tables
Table 1. Tested metrics- Name of metric, formula, and reference
- Abbreviation of phenotype, explanation, frequency, and references
- Coherence score (average pairwise score using that metric), coherence score of other metric, enriched phenotypes, support in GO (still need to add Coexpression and PPI coherence scores)
- IDF modules Tab_Modules-Idf.xls
- uncCorr modules Tab_Modules-UncCorr.xls
| Attachment | Size |
|---|---|
| 86 KB | |
| 296.5 KB | |
| 81.5 KB | |
| 84.5 KB | |
| 157.5 KB | |
| 168.5 KB | |
| 139.5 KB | |
| 168.5 KB | |
| 1.11 MB | |
| 23.5 KB | |
| 32.5 KB | |
| 53.27 KB | |
| 67.96 KB | |
| 89.91 KB | |
| 56.79 KB | |
| 82 KB |